Streamlit은 데이터 사이언스와 머신러닝 프로젝트를 위한 파이썬 웹앱 프레임워크입니다. 이 튜토리얼에서는 Streamlit 1.10 버전에 도입된 멀티페이지 앱 기능을 활용해 기존 싱글페이지 데모 앱을 멀티페이지로 변환하는 과정을 단계별로 살펴보겠습니다.
싱글페이지 앱의 한계
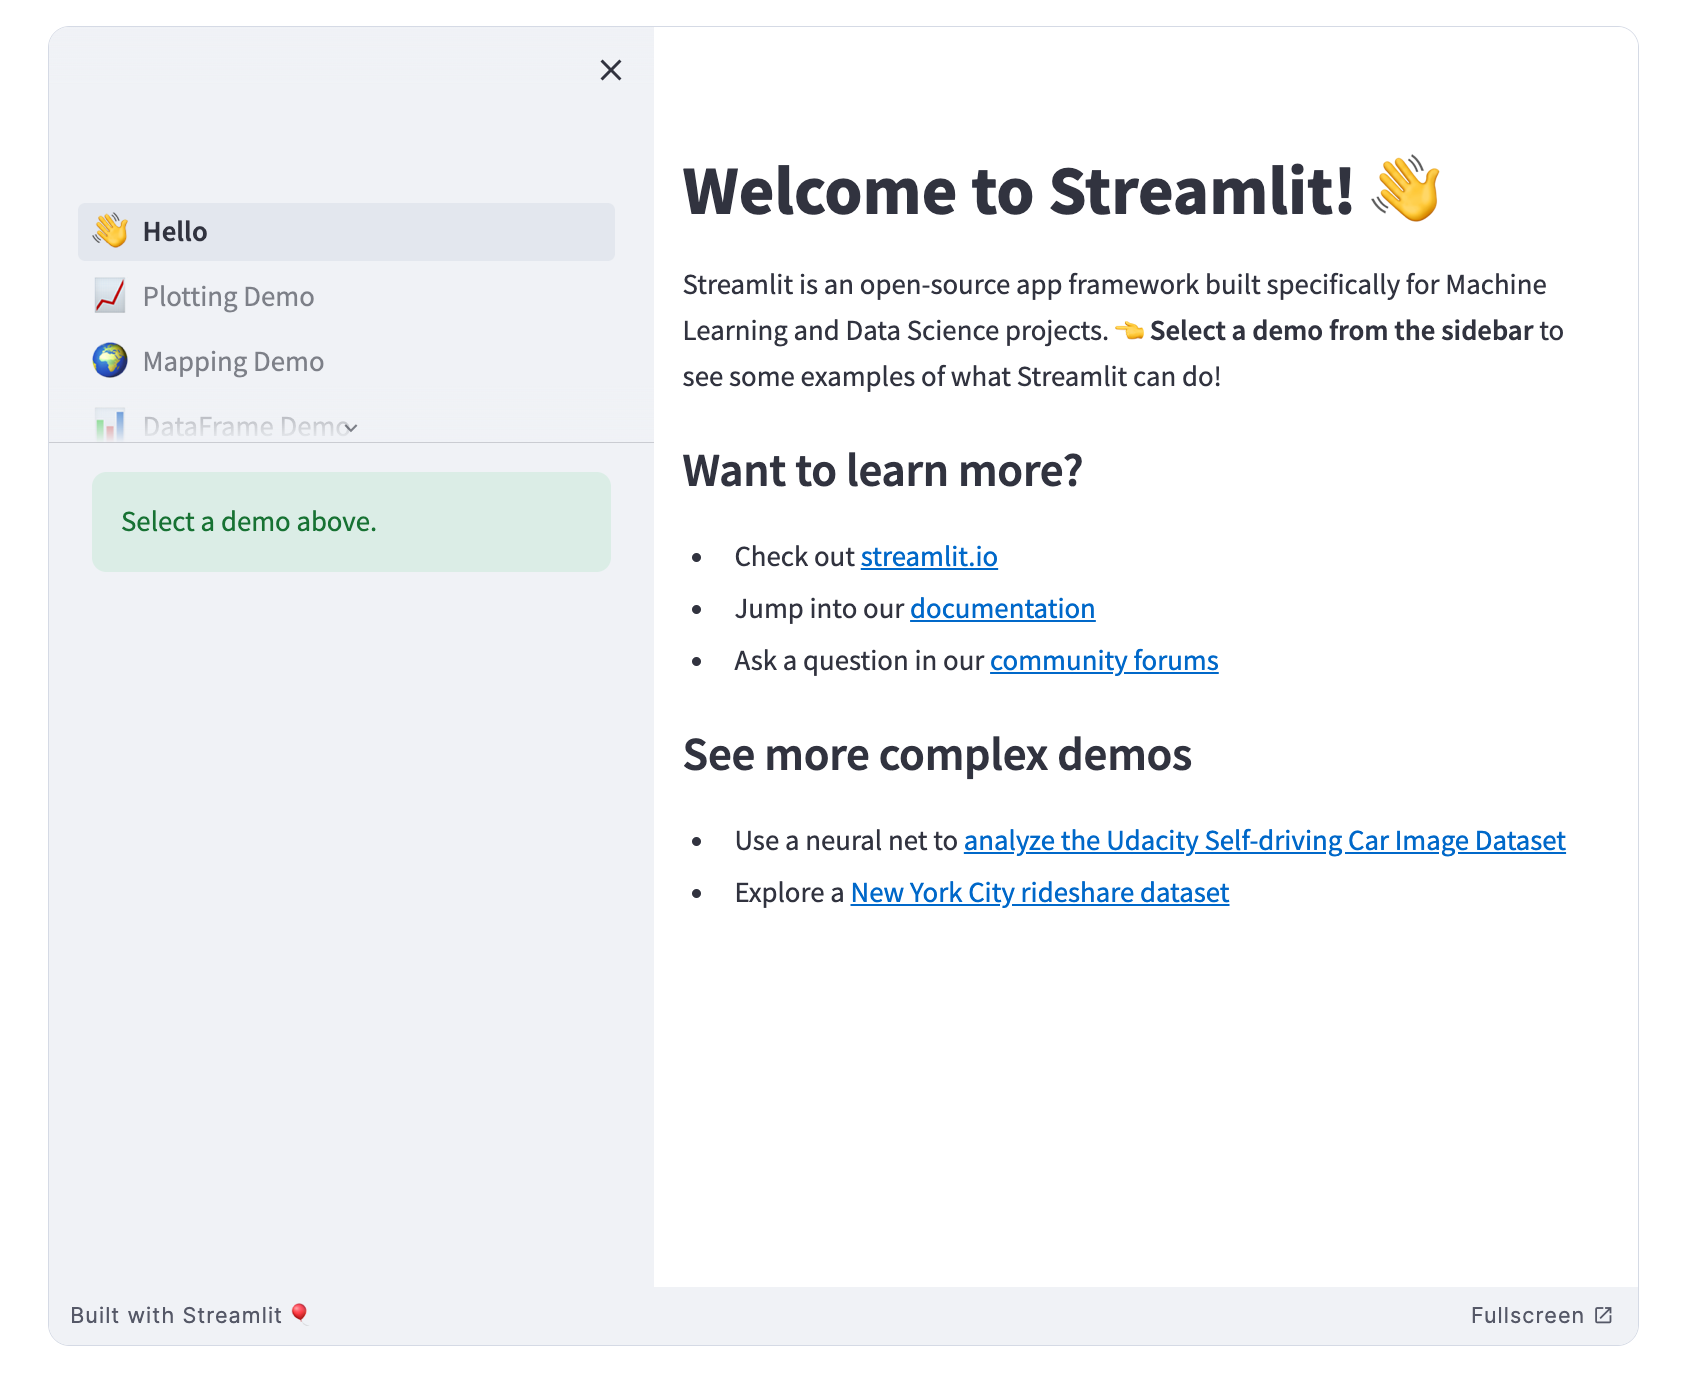
Streamlit 1.10 이전에는 streamlit hello 명령어로 실행되는 데모 앱이 하나의 큰 싱글페이지로 구성되어 있었습니다. 멀티페이지를 지원하지 않았기 때문에 사이드바의 st.selectbox를 사용해 플롯, 맵핑, 데이터프레임 데모 중 하나를 선택해 실행하는 방식이었죠.
이런 방식은 앱의 규모가 커질수록 코드 유지보수에 부담이 되고, 페이지 선택을 위한 UI가 st.selectbox로 제한되며, 개별 페이지의 타이틀을 st.set_page_config로 커스텀할 수 없는 등 여러 한계가 있습니다. 무엇보다 URL을 통한 페이지 간 이동이 불가능하죠.
멀티페이지로 앱 변환하기
이제 싱글페이지 앱의 한계를 극복하고 멀티페이지의 장점을 활용해 봅시다. 기존 앱을 멀티페이지로 변환하려면 다음과 같은 절차가 필요합니다.
- 엔트리포인트 파일(
hello.py)과 동일한 경로에pages폴더 생성 - 엔트리포인트 파일명을
Hello.py로 변경해 사이드바 타이틀 대문자로 표시 pages폴더에 각 데모별 파일 생성
pages/1_📈_Plotting_Demo.pypages/2_🌍_Mapping_Demo.pypages/3_📊_DataFrame_Demo.py
- 기존
plotting_demo,mapping_demo,data_frame_demo함수의 내용을 3번에서 생성한 파일로 이동 streamlit run Hello.py실행해 멀티페이지 앱 확인
이제 변환 과정의 각 단계별로 코드 변경 내용을 살펴보겠습니다.
엔트리포인트 파일 생성
Hello.py를 앱의 엔트리포인트로 지정하고, 사이드바 타이틀을 대문자로 표시하며, 인트로 페이지의 코드만 포함하도록 합니다. 또한 st.set_page_config를 사용해 브라우저 탭에 표시되는 페이지 타이틀과 파비콘을 지정할 수 있습니다.
import streamlit as st

st.set_page_config(
    page_title="Hello",
    page_icon="👋",
)

st.write("# Welcome to Streamlit! 👋")

st.sidebar.success("Select a demo above.")

st.markdown(
    """
    Streamlit is an open-source app framework built specifically for
    Machine Learning and Data Science projects.
    **👈 Select a demo from the sidebar** to see some examples
    of what Streamlit can do!
    ### Want to learn more?
    - Check out [streamlit.io](https://streamlit.io)
    - Jump into our [documentation](https://docs.streamlit.io)
    - Ask a question in our [community forums](https://discuss.streamlit.io)
    ### See more complex demos
    - Use a neural net to [analyze the Udacity Self-driving Car Image Dataset](https://github.com/streamlit/demo-self-driving)
    - Explore a [New York City rideshare dataset](https://github.com/streamlit/demo-uber-nyc-pickups)
"""
)
아직 페이지를 생성하지 않았기 때문에 사이드바에 페이지 목록이 표시되지 않습니다.
여러 페이지 생성하기
페이지 생성 시 주의할 점은 다음과 같습니다.
- 파일명 앞에 숫자를 붙여 페이지 순서 지정 가능
- 파일명으로 앱 페이지명이 결정되므로 변경 시 주의
- 파일명에 이모지를 사용해 재미를 더할 수 있음
- 각 페이지는 파일명으로 정의되는 고유 URL을 갖게 됨
pages 폴더에 각 데모 페이지에 해당하는 파일을 생성하고 관련 코드를 옮깁니다.
pages/1_📈_Plotting_Demo.py:
import streamlit as st
import time
import numpy as np

st.set_page_config(page_title="Plotting Demo", page_icon="📈")

st.markdown("# Plotting Demo")
st.sidebar.header("Plotting Demo")
st.write(
    """This demo illustrates a combination of plotting and animation with
Streamlit. We're generating a bunch of random numbers in a loop for around
5 seconds. Enjoy!"""
)

progress_bar = st.sidebar.progress(0)
status_text = st.sidebar.empty()
last_rows = np.random.randn(1, 1)
chart = st.line_chart(last_rows)

for i in range(1, 101):
    new_rows = last_rows[-1, :] + np.random.randn(5, 1).cumsum(axis=0)
    status_text.text("%i%% Complete" % i)
    chart.add_rows(new_rows)
    progress_bar.progress(i)
    last_rows = new_rows
    time.sleep(0.05)

progress_bar.empty()

# Streamlit widgets automatically run the script from top to bottom. Since
# this button is not connected to any other logic, it just causes a plain
# rerun.
st.button("Re-run")
pages/2_🌍_Mapping_Demo.py:
import streamlit as st
import pandas as pd
import pydeck as pdk
from urllib.error import URLError

st.set_page_config(page_title="Mapping Demo", page_icon="🌍")

st.markdown("# Mapping Demo")
st.sidebar.header("Mapping Demo")
st.write(
    """This demo shows how to use
[`st.pydeck_chart`](https://docs.streamlit.io/develop/api-reference/charts/st.pydeck_chart)
to display geospatial data."""
)


@st.cache_data
def from_data_file(filename):
    url = (
        "http://raw.githubusercontent.com/streamlit/"
        "example-data/master/hello/v1/%s" % filename
    )
    return pd.read_json(url)


try:
    ALL_LAYERS = {
        "Bike Rentals": pdk.Layer(
            "HexagonLayer",
            data=from_data_file("bike_rental_stats.json"),
            get_position=["lon", "lat"],
            radius=200,
            elevation_scale=4,
            elevation_range=[0, 1000],
            extruded=True,
        ),
        "Bart Stop Exits": pdk.Layer(
            "ScatterplotLayer",
            data=from_data_file("bart_stop_stats.json"),
            get_position=["lon", "lat"],
            get_color=[200, 30, 0, 160],
            get_radius="[exits]",
            radius_scale=0.05,
        ),
        "Bart Stop Names": pdk.Layer(
            "TextLayer",
            data=from_data_file("bart_stop_stats.json"),
            get_position=["lon", "lat"],
            get_text="name",
            get_color=[0, 0, 0, 200],
            get_size=15,
            get_alignment_baseline="'bottom'",
        ),
        "Outbound Flow": pdk.Layer(
            "ArcLayer",
            data=from_data_file("bart_path_stats.json"),
            get_source_position=["lon", "lat"],
            get_target_position=["lon2", "lat2"],
            get_source_color=[200, 30, 0, 160],
            get_target_color=[200, 30, 0, 160],
            auto_highlight=True,
            width_scale=0.0001,
            get_width="outbound",
            width_min_pixels=3,
            width_max_pixels=30,
        ),
    }
    st.sidebar.markdown("### Map Layers")
    selected_layers = [
        layer
        for layer_name, layer in ALL_LAYERS.items()
        if st.sidebar.checkbox(layer_name, True)
    ]
    if selected_layers:
        st.pydeck_chart(
            pdk.Deck(
                map_style="mapbox://styles/mapbox/light-v9",
                initial_view_state={
                    "latitude": 37.76,
                    "longitude": -122.4,
                    "zoom": 11,
                    "pitch": 50,
                },
                layers=selected_layers,
            )
        )
    else:
        st.error("Please choose at least one layer above.")
except URLError as e:
    st.error(
        """
        **This demo requires internet access.**
        Connection error: %s
    """
        % e.reason
    )
코드 이동
기존 hello.py 내부의 각 데모 함수에 있던 코드를 해당 서브 페이지 파일로 옮겨줍니다. 예를 들어 plotting_demo 함수 코드는 📈_Plotting_Demo.py로 옮기는 식입니다.
이때 페이지별로 st.set_page_config를 사용하면 제목, 아이콘, 레이아웃 등을 개별 설정할 수도 있습니다. 데모의 특성에 맞게 알맞은 옵션을 줘보세요.
멀티페이지 앱 실행
모든 준비가 끝나면 streamlit run Hello.py 명령어로 앱을 실행합니다.
streamlit run Hello.py
사이드바에 자동으로 페이지 목록이 생성된 것을 확인할 수 있습니다.
이제 페이지 제목을 클릭하면 해당 데모 화면으로 바로 이동합니다. 단일 파일에서 sidebar의 selectbox로 고르던 것과는 사뭇 다른 경험이 될 거에요.
멀티페이지 앱의 장점
싱글 페이지 대비 멀티페이지 앱의 장점은 아래와 같습니다.
- 페이지별로 파일이 분리되어 규모가 커져도 코드 관리가 용이함
- Streamlit 명령어로 제목, 아이콘 등 페이지별 설정 가능
- 고유 URL을 통해 개별 페이지에 직접 접근 가능
- 사이드바에서 페이지 이동이 쉬워져 전반적인 사용성 향상
- 확장성이 뛰어나 앱의 규모 확장에 유리
마무리
이상으로 기존 싱글 페이지 Streamlit 앱을 멀티페이지로 전환하는 과정을 살펴봤습니다. 정리하자면 pages 폴더를 만들고, 메인 파일을 수정한 뒤, 서브 페이지용 파일을 생성해 기존 코드를 옮기기만 하면 됩니다. 크게 어렵지 않은 작업이면서도 앱의 확장성과 사용성을 크게 높일 수 있는 방법이라 할 수 있죠. 이제는 여러분이 직접 다양한 멀티페이지 앱을 개발해볼 차례입니다. 튜토리얼에서 사용한 예제를 시작으로 점차 페이지를 늘려가며 새로운 기능을 추가하다 보면, 어느새 근사하고 쓸모있는 Streamlit 앱이 완성될 거에요.
개발이 완료된 앱은 Streamlit Community Cloud를 통해 무료로 배포 할 수 있습니다.
Streamlit 멀티페이지 앱 개발과 관련해 더 자세한 내용이 필요하다면 아래 Streamlit 공식 문서를 참고해보시기 바랍니다. 체계적으로 잘 정리되어 있어 큰 도움이 될 것입니다.
https://docs.streamlit.io/get-started/tutorials/create-a-multipage-app